Works Integrations
E-commerce Operations Dashboard
Shows a small online retailer its orders, stock, returns and contribution profit with numbers that reconcile.
Founders and operations leads of small online stores, starting with a perfume retailer, who run the business from a storefront admin and spreadsheets.
Shown as Halo & Hearth, an invented business, on sample data.
What it solves.
Storefront dashboards report sales, not profit. Once discounts, refunds, payment fees, shipping and packaging are taken into account the picture changes, and a supplier price change should not rewrite last month. The product processes storefront-style events into an order and inventory model that snapshots costs at purchase, handles partial returns correctly and reports contribution profit by an explicit order cohort.
- 01 Storefront event
- 02 Order and stock
- 03 Fulfilment
- 04 Return and refund
- 05 Contribution profit
- Operational analytics
- Event processing with deduplication
- Inventory movements
- Returns and refunds
- Reliable money calculations
Try it in two to three minutes.
Follow the steps or explore on your own. Each step opens the demo at the right page, and the demo offers the same tour the first time you visit.
-
Step 1
Open the store dashboard
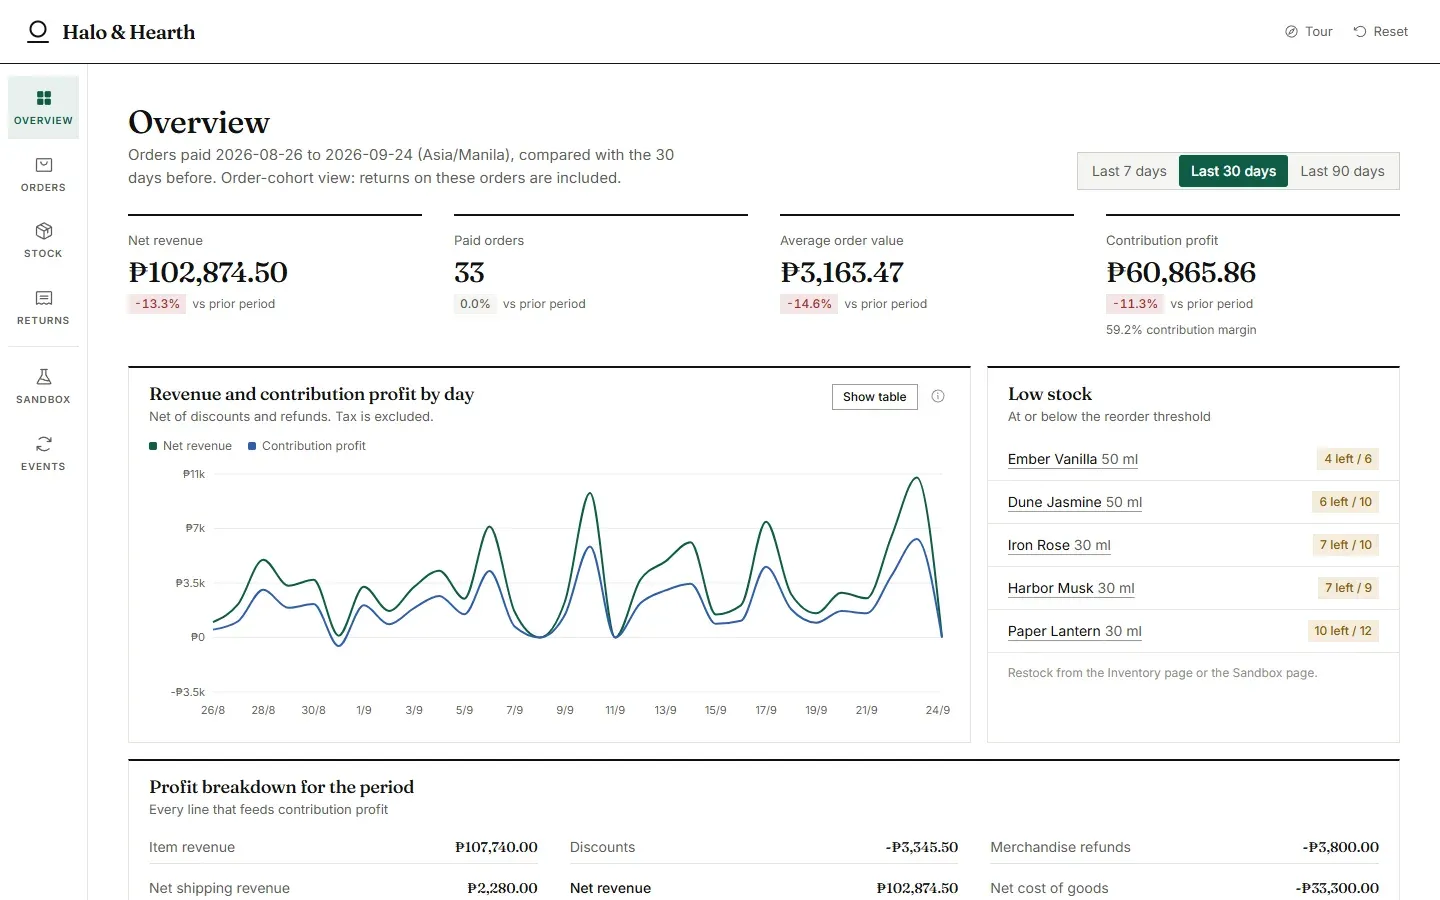
Net revenue, orders, average order value and contribution profit for a chosen range, compared with the period before. Switch the chart to a table.
-
Step 2
Inspect an order
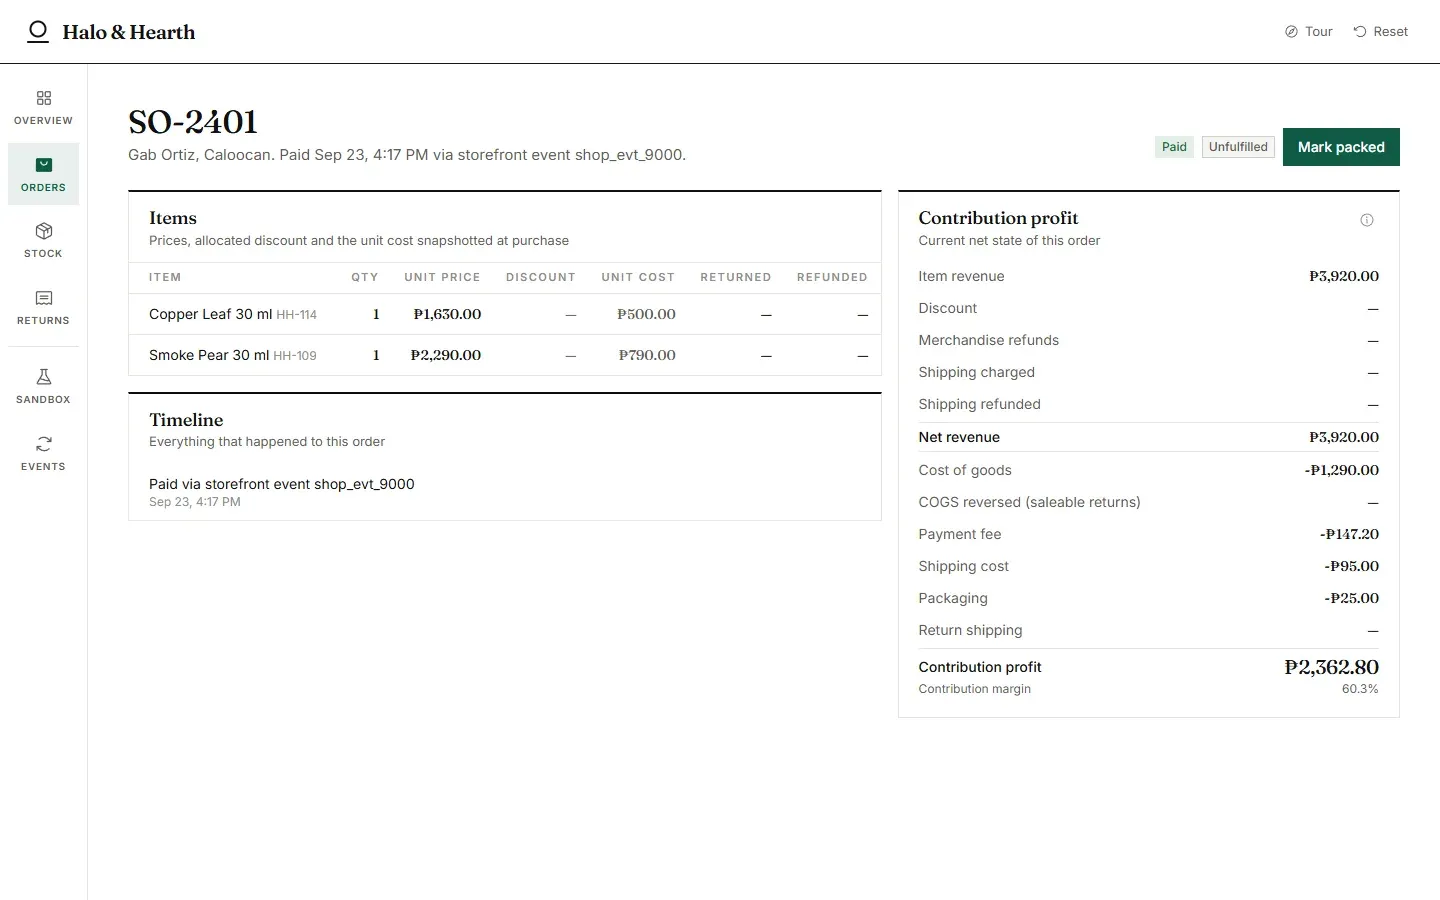
Open any order for its contribution profit breakdown, the cost snapshotted at purchase, and its timeline.
-
Step 3
Send a paid order
Send a storefront event. Stock is allocated atomically and the dashboard moves. Replay the same event and nothing doubles.
-
Step 4
Change a supplier cost
Preview the margin at a proposed cost, apply it, and confirm historical orders did not change.
-
Step 5
Retry the failed event
One event failed on stock. Receive stock for that product, then retry it from integration activity.
-
Step 6
Process a partial return
Refund eligible units only, decide whether the item is saleable, and see stock and profit update.
What’s on each screen.
-
Overview
Net sales, orders, average order value, contribution profit, low-stock summary.
-
Orders
Search and filter, order details, fulfilment state, profit breakdown, timeline.
-
Inventory
SKU, stock, cost, selling price, low-stock threshold, movement history.
-
Returns
Eligible items, quantities, refund preview, condition and restock decision.
-
Sandbox
New paid order, duplicate event, supplier cost change, restock.
-
Integration activity
Event payload summary, processing result, retry and error state.
What runs for real, and what doesn’t.
Nothing leaves the browser, and every name and figure in the demo is made up. A production build carries your brand and connects to your systems.
Runs for real
- Stock allocation, refunds and restocks run as transactions with idempotency protection.
- Contribution profit follows a published formula and is verified by automated tests.
- Date filters, chart totals and CSV exports use the same order cohort.
Simulated
- Storefront, payment and courier events come from the Sandbox page. No store, payment provider or courier is connected.
- Tax is excluded.
A production build adds
- Live store, payment and courier integrations
- Marketplace sync
- Tax accounting and multi-currency
- Multi-warehouse stock and purchase orders
- Demand forecasting
Have a workflow like this one?
Tell us how close it is, and what your business actually needs. The first session is free and thirty minutes.
Or see the other products we’ve built.